


.jpg)
.png)


The year 2013 marks the "Silver Anniversary" of three key announcements that identified relationships among various lipid fractions, lipoproteins, apolipoproteins, non-lipid disorders and cardiovascular disease (CVD) risk. In 1988, NCEP ATP I1 recognized evidence that high levels of low density lipoprotein cholesterol (LDL-C) contributed to increased CVD risk and subsequently this has become the primary lipoprotein lipid target to reduce CVD.2-4 They recognized that high density lipoprotein cholesterol (HDL-C) was associated with reduced CVD risk.5-7 The 1988 NCEP 'expert laboratory panels' also provided guidelines for measuring LDLC9, HDL-C10, and triglycerides (TG).11 Both HDL-C and calculated LDL-C have remained cornerstones of lipoprotein lipid measurements for guiding lipid-lowering therapy for over 25 years.
In the second key 1988 announcement, Gerald Reaven, MD, described the etiology of known clustered metabolic CVD risks as, primarily, a consequence of resistance to insulin-stimulated glucose uptake and resistance to insulinstimulated suppression of adipose tissue lipolysis. Insulin resistance, secondarily, leads to compensatory hyperinsulinemia, impaired glucose tolerance (IGT), elevated circulating free fatty acids and TG and decreased circulating HDL-C. He suggested that the insulin resistance 'syndrome X' played a central role in the pathogenesis and clinical course of type 2 diabetes mellitus (T2DM), hypertension, and CAD, and "likely explained most of the CVD risk in the general population" including many obese, overweight, or physically inactive individuals, as well as, those individuals with T2DM.12 The third 1988 key announcement shed doubt on the simplicity and predictability of LDL-C per se. Researchers from Lawrence Berkeley Laboratory introduced the Atherogenic Lipoprotein Phenotype (ALP) concept, with the identification of two distinct lipoprotein phenotypes; (Pattern A) characterized by a predominance of large, buoyant LDL particles and (Pattern B) characterized by more circulating small, dense LDL particles. They found that, compared with the Pattern A, Pattern B phenotype was associated with greater risk of myocardial infarction.13-15 Pattern B dyslipidemia was also associated with increased apolipoprotein B (ApoB), VLDL, hypertriglyceridemia, and decreased levels of HDL-C and apolipoprotein A-I (ApoA1) levels.13
A link was established between Syndrome X, T2DM, and ALP.16,17 Having plasma TG concentration >130 mg/dL, a TG/ HDL >3.0 and insulin concentrations (>109 pmol/L) aided in the identification of overweight individuals who were sufficiently insulin resistant to be at increased risk for CVD outcomes.18 An increased TG/HDL ratio, a surrogate of insulin resistance, was highly predictive of a first coronary event, regardless of BMI value.19
The Copenhagen Prospective Cardiovascular (Male) Study, estimated that approximately 35% of the populationattributable CVD risk, associated with high TG and low HDL-C levels, was independent of LDL-C level, hypertension, smoking history, or level of physical activity.20 The Helsinki Heart Study (HHS) reported a link between the high TG and low HDL-C and greater risk for CHD. They found that while there was an overall 34% relative risk reduction among gemfibrozil users for the entire HHS cohort (mean TG 176 mg/dL); almost the entire benefit of gemfibrozil (a 56-71% RRR) was noted in the group defined by either low HDL-C or high TG or both. The investigators suggested a personalized or individualized targeting or "tailoring of drug therapy" with fibrates, for this high risk group.21 The early monotherapy fibrate studies may have influenced the NCEP ATP III panel’s recommendations for fibrate use in these subgroups.
Although hypothesis-generating observations (in need of a dedicated clinical trial to test this hypothesis in this population as the primary cohort) similar results were obtained in four subsequent fibrate studies. There was remarkable consistency noted in all of the post-hoc subgroups analyses from each primary study (usually analyzing <20% of the entire primary cohorts). Three independent meta-analyses, combining ‘moderate dyslipidemia’ subgroups, in all five trials (HHS, VA-HIT, BIP, FIELD, ACCORDLipid), demonstrated the consistent highly significant fibrate benefit.22-24
Metabolically circulating LDL-C must first undergo some modification and this affects the structure of its apolipoprotein B (ApoB) moiety. This is necessary for it to become a ligand for the scavenger receptors of monocyte macrophages. As a gradient-driven diffusion process, the more LDL-ApoB particles present in the circulation, whether by overproduction or by reduced clearance, the more LDL-ApoB particles infiltrate arterial walls. This sets in motion the cascade of events that leads to atherosclerosis.25 The intimal retention of LDL-ApoB particles is thought to reflect an imbalance between the entry and the efflux of lipoproteins via the media and its adventitia.26-28
Recognizing the importance of all atherogenic lipoprotein particle concentrations, the NCEP ATP III (2001) identified non-HDL-C as a secondary target for therapy, after LDL-C goals have been met, in patients who have elevated triglyceride levels >200 mg/dL. Non-HDL-C is a surrogate for all of apolipoprotein-B-containing particles, carrying cholesterol into the arterial wall [LDL-C, VLDL-C, IDL-C, chylomicrons, chylomicron remnants, and Lp(a)]. Another secondary target identified by ATP III is having the 'Metabolic Syndrome.' ATP III also suggested that advanced cardiovascular panels could include, testing for ‘emerging risks’ such as ApoB and lipoprotein (a), ApoA1.29
Since LDL particles vary in both their cholesterol and triglyceride contents, LDL-C, per se, does not always provide a precise and/or accurate measure of the circulating concentration of heterogeneous LDL particles. This is particularly true in the hypertriglyceridemic environment, when LDL particles are particularly cholesterol-depleted, small in size and large in number. Nuclear magnetic resonance (NMR) spectroscopy, which measures lipoprotein particle concentrations directly has been utilized to study the significance of elevated low density lipoprotein particle concentrations (LDL-P). NMR analysis of the Framingham Offspring Study demonstrated a significant Once the discordance between LDL-C and LDL-P in patients with low levels of HDL-C. This implied that the excess CAD risk likely results from an excess of cholesteroldepleted LDL particles and suggested that many patients with normal levels of LDL-C, but low-levels of HDL-C, would benefit from LDL-lowering therapy.30 The Framingham Heart Study data also found that LDL-P>LDL-C discordance is strongly linked to all five metabolic syndrome markers. Thus the enhanced risk of patients with metabolic syndrome may come from underappreciated or unrecognized LDL-P elevations. Of interest, in contrast to a graded association of increased small LDL-P with presence of more components of the metabolic syndrome, LDL-C concentrations per se, did not show a stepwise increase.31
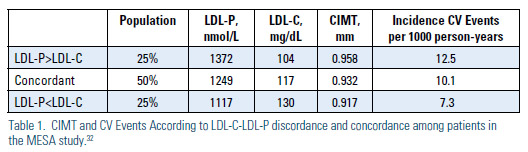
The Multi-Ethnic Study of Atherosclerosis (MESA) trial analysis suggested that distinguishing concordance and the extremes of discordance [Discordant LDL-P <LDL-C, Concordant LDL-P ~ LDL-C and Discordant LDL-P > LDL-C] can aid in identifying the need for aggressive treatment.32 While LDL-C and LDL-P levels were both associated with overall incident CVD in the MESA trial (HR 1.20, and 1.32, respectively), among those with discordant levels, only LDL-P was associated with incident CVD (HR 1.45) vs. LDL-C (HR 1.07). Carotid intimal media thickness (CIMT) also tracked with LDLP, rather than LDL-C in this study. The adjusted mean CIMT found in the LDLP> LDL-C discordant subgroup (25% of studied population) was thickest at 0.958 mm. In the concordant subgroup (50% of studied population) was 0.932 mm. In the LDL-<LDL-C discordant (25% of the population) subgroup was thinnest 0.917 mm with the differences persisting after adjustment for LDL-C (p=0.002), but not LDL-P (p=0.60).
During follow-up, 160 CVD events were experienced by individuals with concordant LDL-C and LDL-P. Event rate was 10.1 per 1000 person-years, adjusted for age, gender, and race. This contrasted with 101 and 58 events (adjusted rates of 12.5 and 7.3 per 1000 person-years, respectively; P .0025) for those with LDL-P>LDL-C and LDL-P<LDL-C discordance. Mean levels of LDL-P in the three subgroups tracked positively with atherosclerotic risk (increased CIMT and CVD events); whereas LDL-C levels were inversely related to risk. Thus, for individuals with discordant LDL-C and LDL-P levels, the LDL-attributable atherosclerotic risk was better predicted by LDL-P in the MESA study (Table 1).
.jpg)
Accumulated studies have demonstrated strong evidence that Non-HDL-C is a surrogate measure for atherogenic particle measurements in assessing at-risk ‘populations.’ However, support that particle via ApoB or LDL-P measurement is a better measure for predicting 'individual' risk exists as well. There is a very large 2011 meta-analysis of 15 independent published analyses, from 2004-2009, identifying a total of 233,455 subjects and 22,950 events.33 The author-investigators calculated the number of clinical events prevented by a high-risk treatment regimen of all those greater than the 70th percentile of the US adult population using each of the three atherogenic markers. Over a 10-year period, using non-HDL-C as a surrogate would prevent 300,000 more events than a strategy that targets only LDL-C. This article suggests that using ApoB as a surrogate would prevent 500,000 more events than using a non- HDL-C strategy alone (Figure 1). These authors argue "the dispute about choice of markers is a dispute with consequence."
Describing the observations and conclusions from studies of ApoB as the best atherogenic marker, the authors provide four major arguments for using particle concentration as the preferred risk marker for predicting risk in managing individual patients:
- ApoB identifies major LDL particle abnormalities not evident when LDL-C alone is used. In patients with T2DM and/or metabolic syndrome LDL-C level may be normal, but ApoB level may be elevated. The predictive power of non-HDL-C is related more to LDL-P than to inclusion of VLDL particles.34
- Not all hypertriglyceridemic patients have elevated ApoB and not all hypertriglyceridemic patients have elevated ApoB. LDL-P and ApoB are often normal in patients who present with low HDL-C and otherwise normal lipids.35,36 ApoB and LDL-P measurements allow individuals with elevated LDL-C,but normal ApoB levels, to be recognized.37 Identification all of the atherogenic dyslipoproteinemias can be accomplished by measuring ApoB, along with TChol and TG levels, including familial combined hyperlipidemia and familial dysbetalipoproteinemia.38
- Recognized errors in the measurement of HDL-C, a component of the Friedwald equation, may in turn affect the accuracy of non-HDL-C measurement.39 Clinical assays for ApoB, on the other hand, have become reliable, robust, and can be measured on non-fasting samples at low cost.40 Accordingly, ApoB is superior to LDL-C and non-HDL-C as a laboratory analysis and reducing laboratory error will in turn reduce clinical errors in individual patient care.
- While in large statin trial populations, non-HDL-C and ApoB are generally equivalent risk markers, ApoB is superior for identification of the individual that will benefit from an increased dose of statin. In statin-treated 'populations,' ApoB level identifies more individuals at increased risk, compared with LDL-C measurements.41
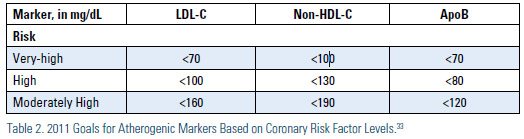
Based on the most recent statin clinical trials, Sniderman, Williams, Contois, et al.32, in 2011, suggested that in patients at 'very high risk,' the ApoB target should be <70 mg/dL, with no lower limits. They suggested for those patients at ‘high risk’ an appropriate ApoB target should be <80 mg/dL and for the ‘moderately high risk’ patients, the ApoB target would be <120 mg/dL. For non-HDL-C the targets are <100mg/dL, <130 mg/dL and <190 mg/ dL, respectively; and for LDL-C <70mg/ dL, <100 mg/dL and <160 mg/dL, respectively (Table 2).
A key concept is the inverse relationship that exists between HDL-C and ApoB or LDL-P, such that lower levels of HDL-C tend to be associated with higher levels of ApoB.42 Both HDL and LDL can participate in cholesteryl ester transfer protein (CETP)-mediated lipid exchange where the VLDL-triglyceride moves to the HDL and LDL particles in exchange for cholesterol ester moving to the VLDL fraction. Thus, a higher HDL-C points to less core lipid exchange and greater concordance between LDL-C and ApoB. Conversely, a lower HDL-C points to more core lipid exchange and, therefore, greater discordance between LDL-C and ApoB. When ApoB and LDL-C are concordant, they predict risk equally, whereas when they are discordant, ApoB will be superior. Therefore, compositional changes related to CETP mediated lipid exchange explain much of the variance in predictive power between LDL-C and ApoB.
Considerable controversy continues to exist with regard to the need for additional markers beyond LDL-C and non-HDL-C. Not all studies show this superiority of ApoB over non-HDL-C. Among statintreated patients (n=38,153), on-treatment levels of LDL-C, non-HDL-C, and ApoB were each associated with risk of future major cardiovascular events, but the strength of association, relative to LDL-C (HR 1.13) was greater for non-HDL-C (HR 1.16, p = 0.002) than for ApoB (HR 1.14, p=0.02).43
In a very large analysis (n=302,430) of people, without initial vascular disease, from 68 long-term prospective studies, mostly in Europe and North America, involving 2.79 million person-years of follow-up, there were 8,857 nonfatal myocardial infarctions, 3,928 coronary heart disease [CHD] deaths, 2,534 ischemic strokes, 513 hemorrhagic strokes, and 2,536 unclassified strokes. The analysis44 demonstrated that lipid risk assessment can be simplified by measurement of either cholesterol levels or apolipoproteins, without the need to fast, and without regard to triglyceride. This conclusion derives from several findings including:
- Hazard ratios (HRs) with non-HDL-C and HDL-C that were nearly identical to those seen with ApoB and ApoAI, ultimately suggesting that vascular risk assessment should consider cost, availability, and standardization of assays.
- HRs for vascular disease with lipid levels were at least as strong in participants who did not fast as in those who fasted.
- Non-HDL-C and direct LDL-C measurements HRs were similar.
- Triglyceride concentrations were not independently related with CHD risk after controlling for HDLC, non-HDL-C, and other standard risk factors, including null findings in women and under non-fasting conditions in both genders. Hence, for population-wide assessment of vascular risk, triglyceride measurement provided no additional information about vascular risk given knowledge of HDL-C and TChol levels. The exception may be the triglyceride measurement performed to prevent pancreatitis.
Summary
Given the absence of clinical trials targeting the population where this issue matters most, and given divided expert opinions, it would be unreasonable to abandon measurements of lipoprotein cholesterol content, LDL-C and Non- HDL-C as predictors of risk. However to move the science further, the NCEP or NHLBI expert 'laboratory panels' will need to establish recommendations for standardization and analytic performance targets for apolipoprotein B and lipoprotein particle numbers, as in the past for lipids and lipoprotein measurements. Once the standardization of these biomarkers is no longer debatable, we believe that measurement of particle concentrations is likely to become mainstream. Management guidelines, after all, require an evidencebased approach and each lipid modifying agent should undergo a pre-specified designed RCT to demonstrate their comparative effectiveness for atherogenic biomarker reduction coincident with CV events. A caveat is in order: one of the issues with future prospective RCT may be insurmountable. Now considered unethical by many, prior RCTs on this issue were placebo-controlled. Because residual risk is an important issue, each new or existing drug class will need to demonstrate effectiveness against secondary targets (i.e., non-HDL-C) and then either ApoB or LDL-P in comparison.
The superiority of these surrogates when applied to selected individuals, as opposed to evaluation in large populations, appears to be particularly important in persons with cardiometabolic risk, i.e., moderate hypertriglyceridemia in the setting of elevated ApoB, as in the metabolic syndrome and diabetes. Thus, many, but not all, lipid specialists recommend a greater focus beyond non-HDL-C, to assess residual CVD risk in statin-treated patients. Changes in LDL-C can result either from changes in LDL particle concentration or cholesterol content, or both. Common lipid-modifying treatments affect both LDL lipid composition and particle number, causing the magnitude and even direction of changes in LDL-C and LDL-P to differ. Statins reduce LDL particles, but reduce LDL cholesterol content more. This issue is very clinically relevant because other lipid-modifying therapies that increase LDL size (niacin, fibrates, omega-3 ethyl esters, glitazones and therapeutic lifestyle) reduce LDL-P more than LDLC. To date, no trial has yet been carried out that specifically targets the high-risk ‘discordant’ individuals, likely responsive to these agents. However, support for this concept is suggested by significant benefit seen in post-hoc subgroup analyses and independent meta-analyses of the high TG (>200 mg/dL) and/or low HDL-C (<40 mg/dL) fibrate trial subgroups.22-24
Assessment of individuals at risk has evolved from simple lipids (cholesterol and triglycerides) to lipoproteins (predominantly VLDL-C, LDL-C, and HDL-C), to lipoprotein size determinations, to surrogates of atherogenic cholesterol (non-HDL-C), to lipoprotein-associated apolipoproteins (predominantly ApoB and ApoA1), and to LDL particle numbers (as LDL-P or ApoB), as well as non-lipid biomarkers and imaging assessments. There is recent evidence to suggest that increased HDL particle number (HDL-P) is a better measure of cardiovascular risk than HDL-C.47 This raises the possibility that when therapies increase HDL-P, regardless of changes in HDL-C, HDL functionality, such as macrophage cholesterol efflux, or other beneficial properties attributable to HDL, might also improve.42 In this regard, at least as monotherapy, fibrate benefit was associated with both increased HDL-P and reduced LDL-P, in the low-HDL targeted VA-HIT trial population.48
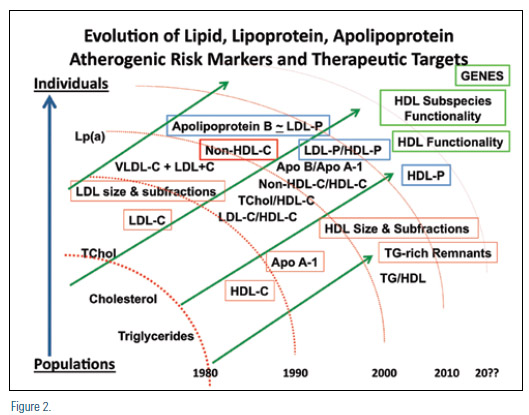
Identification of optimal biomarkers of risk are clearly important to optimum risk assessment. Individualized therapies based on pharmacologic-induced outcome benefits using HDL sub-species functionality may be in the future. Once proven to be clinically relevant, genetic testing may be utilized to identify risk and also to dictate appropriate treatment modalities for individuals (Figure 2). The future may also bring new ethical dilemmas associated with polymorphism identification that facilitates genetic engineering to avoid (cardiovascular) disease.
Disclosure statement: Dr. Gill has received honoraria from Lantheus Medical Imaging. Dr. Rosenblit has received research grants from Amgen, AstraZeneca, Daiichi Sankyo Inc., Eisai, Eli Lilly & Co., GlaxoSmithKline, Mannkind, Merck & Co, Novartis, Novo Nordisk, Orexigen, Sanofi-Aventis, Takeda Pharmaceuticals, and Tolerx. Dr. Rosenblit has received honoraria from Abbott (Abbvie) Laboratories, Amarin Corp., AstraZeneca, Boeringher Ingelheim, Bristol-Meyers Squibb, Dexcom, Eli Lilly & Co., GlaxoSmithKline, Kowa Pharmaceuticals America, Merck & Co., NovoNordisk, Sanofi, and Santarus. Dr. Thompson has no disclosures to report.
Article By:

Director, Diabetes/Lipid Management & Research Center, Huntington Beach, CA
Clinical Professor, Dept. of Medicine, Division Endocrinology/Diabetes/Metabolism,
University of California, Irvine (UCI) School of Medicine, Irvine, CA
Co-Director, Diabetes Out-Patient Clinic, UCI Medical Center, Orange, CA
Diplomate, American Board of Clinical Lipidology

Professor of Medicine, Department of Medicine, Division of Cardiology
Adjunct Professor of Radiology, Director of Echocardiography
Harborview Medical Center, University of Washington
Clinical Professor of Diagnostic Ultrasound
Seattle University
Seattle, WA
Diplomate, American Board of Clinical Lipidology

Swedish Hospital Medical Center
Seattle, WA
Diplomate, American Board of Clinical Lipidology
Comments
TG:HDL and CV risk
TG:HDL ratio and CV Risk