


.jpg)
.png)


This issue of Lipid Spin has a theme of physical findings. One of my colleagues e-mailed me and said I was such an evidence-based guy that he applauded me for choosing a topic that was not evidence based.
While I understand where he was coming from, I submit that nothing could be farther from the truth. Tools for evidencebased practice include history and physical findings from the get-go. This is because those are our best tools for determining how to arrive at a diagnosis.
We can't treat properly without a diagnosis, nor can we even arrive at a prognosis until we understand the diagnosis. We can't unleash how to use the best evidence available to integrate patient values and our clinical judgment for optimum choice until we arrive at a diagnosis.
Each of the findings discussed in this issue is helpful, yet not necessarily specific. Other important concepts come into play before we can treat, monitor and look for harm.
A review of some important evidence-based medicine tools useful for diagnosis is in order.
A diagnostic test is ordinarily understood to mean a test performed in a laboratory or an imaging study. However, the principles in this article apply equally well to clinical information obtained from history, physical exam, lab tests and/or imaging procedures.
They also apply when a constellation of findings serves as a diagnostic test. Clinical measurements, including data from diagnostic tests, are expressed as nominal, ordinal or interval scales. Regardless of the data produced, as clinician we reduce the data to a simpler form to make it useful in practice. Most ordinal scales are an example. Murmurs can vary from loud to inaudible, but a simple ordinal scale with grades I through IV serves well. We do this when test results are used for therapy. We either treat or we don't. Blood pressure is an example. It is measured on an interval scale, yet we decide to treat based on a particular level, such as 140/90. So here we transform the interval data into dichotomous data. Or we turn it into ordinal data and break it down into prehypertension, or Stage 1 or Stage 2 hypertension.
The diagnostic process is imperfect. We deal with probability. We use "rule out" or "possible," etc. Increasingly, we use the likelihood that there is a disease as a probability.
A test's accuracy is considered in relation to a gold standard. That standard could be easy, such as a culture, or it could be invasive, such as a liver biopsy or an autopsy. For some diseases diagnosed at follow-up suffices. Screening for many CVD conditions falls into this type. Because it is costly to obtain hard outcomes and it takes feasibility and time, we are always looking for surrogates, with the understanding that some misclassification is inevitable. We justify risk by pointing out issues of safety and convenience, but simpler tests are useful only when risks of misclassification are known and are acceptably low. To figure this out, we need to know how many are truly positive or negative, as well as how many are falsely so. Most information about these tests is from clinical information, not research, and data on the number of true vs. false negatives often tend to be much less complete than data about positive results.
Always look to see if the test is applied to those thought not to have the condition of interest, as well. How many magnetic resonance imaging (MRI) studies are done this way? For some conditions, there is no gold standard. What about angina? Sometimes we must compare to an imperfect gold standard. Look for studies that compensate for this to avoid false conclusions about a new test, such as studies that compare both tests on the same persons. It could be superior if it were more sensitive than the standard test. The additional patients identified would have been considered false positive if you relied on the old standard, imperfect test.
This is why we refer to soft outcomes and hard outcomes. This is why we often are skeptical about studies that do not have a hard outcome gold standard from which to work.
 Sensitive tests are useful to confirm a diagnosis. A highly specific test is rarely positive in the absence of disease. We choose a sensitive one when the penalty for missing a disease is high. While we would like to have a test that is both sensitive and specific, rarely can we have this and almost always we need to make a tradeoff. Therefore, we set up cut points. The point on the continuum between normal and abnormal is arbitrary.
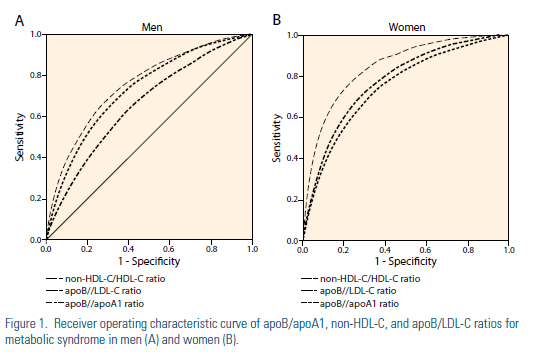
Receiver operator curves are used (ROC) to express the relationship between sensitivity and specificity. Tests that discriminate well crowd toward the upper left corner of an ROC. The overall accuracy for the population studied can be expressed as the area under the ROC. Sensitivity can be on the Y axis and specificity on the X axis or, more commonly, sensitivity on the Y axis can be compared to 1-specificity on the X axis. An example from the recent literature is shown.
As practitioners, however, we must use other means to circumvent the tradeoff between sensitivity and specificity.
The most common way is to use results of several tests together. Our history and physicals can be considered as one of several tools. Not infrequently a new test is described in glowing terms, only to be found wanting with wider experience. This can even suggest dishonesty or unfair skepticism. Most often it is related to limitations in methods for which the test was established in the first place. Maybe there was an improper gold standard. It may have been because an inadequate spectrum of patients was evaluated. There may have been bias in judgment of the test performance. It could have been because of statistical uncertainty related to small numbers.
The sensitivity and specificity of a test should be established independently of the means by which the diagnosis was established. When the sensitivity and specificity of a test is assessed, the test result should not be a part of the information used to establish the diagnosis.
We can use this to our advantage. Many imaging studies are subjective. It is easy to be influenced by the clinical information being over-read or under-read. Both to minimize and take advantage of these biases, some radiologist prefer to read twice, before and after the clinical information that we provide.
We always need to take into consideration our clinical settings. Referral to a teaching hospital, ward or clinic, or emergency room increases the chance of significant disease as a cause of complaints. Relatively more tests and aggressive use of diagnostic tests may be more justified. In primary care practice, however, the chance of finding disease is considerably smaller and tests should be used more sparingly.
Published descriptions of diagnostic tests often include a predictive value or conclusion about the interpretation of a positive or negative test. This is helpful as long as we understand the limitations. Data from large teaching hospitals where prevalence of disease is high can be misleading. Even worse, some authors compare performance of a test in an equal number of patients with and without the disease. While this is an efficient way to describe sensitivity and specificity, any reported positive predictive value means little, because the authors artificially set the prevalence at 50%.
We can use multiple tests in parallel. Generally, this increases sensitivity and the negative predictive value for a given disease prevalence above an individual test. Usually, specificity and positive predictive value are lower than for one test. This is useful when we need very sensitive testing but have available only two or more relatively insensitive tests that measure different clinical phenomena. The price, though, is further evaluation of some patients without disease. For some medical conditions, physical findings and lab results can be great tools, and combinations are called clinical prediction rules or diagnostic decision rules. Sensitivity, specificity and likelihood ratios then can be calculated for these rules.
Likelihood ratios are an alternative way of describing performance of diagnostic tests. They can be used to summarize probability of disease after a positive or negative test. An advantage is that they can be used at multiple test levels. Serial likelihood ratios can also be utilized.
Hx & PE pre-test probability
TEST 1 Pre-test odds x LR=Post-test odds
Test 2 Pre-test odds x LR2=Post-test odds
Test 3 Pre-test odds x LR3=Post-test odds
POST-TEST PROBABILITY
*****The premise of independence underlies the use of multiple tests, though it seems very unlikely that tests for most diseases are independent of one another. This also depends on how reproducible and accurate the test itself is, and/or how many observers were used, and what their intraand inter-observer agreement really is. Bottom line: It takes clinical skill, all started by your knowledge and use of history and physical findings.
So think of physical findings as diagnostic tests.
For further elaboration of these concepts, readers may want to review The Evidence Base of Clinical Diagnosis, edited by J. Andre' Knottnerus.
Disclosure statement: Dr. Wild has received honoraria from the National Institutes of Health and the U.S. FDA.
Article By:

Clinical Epidemiology and Biostatistics and
Clinical Lipidology Professor
Oklahoma University Health Sciences Center
Oklahoma City, OK
Diplomate, American Board of Clinical Lipidology